Please read the disclaimer at the bottom of this page

Saturday, November 24, 2007

Conclusion

I've waited 2 weeks for your reactions and was happy to receive many, either by e-mail or as a comment here on this site.

This is a short summary of those reactions:
- systems are likely over-optimized and lack adaptability to different market conditions
- more criteria than just the Sharpe ratio are needed to select a system
- longer timeframes (e.g. 3-5 years) are needed to select a system
- subscriber should ask vendor if fundamental analysis is part of the system (not relying on only technical analysis)
- results cannot be generalized to all C2 systems, since analysis was limited to end-of-day stock systems
- recent market conditions were unusual

Here's my own opinion. First, I agree that out of the 100 systems I included, a substantial number could have been suffering from over-optimization. The problem is that it is hard to tell from the Sharpe ratio (and perhaps any other statistic) which system is likely over-optimized and which one isn't. I.e. if you have 100 over-optimized systems some of them will still show reasonable Sharpe ratios when going live (on C2) for a substantial amount of time.

Second, using more selection criteria than just the Sharpe ratio might be a good idea. However, these other criteria would need to have low correlation with the Sharpe ratio and still measure reward/risk in some way. Very difficult to find such criteria... An additional problem is that as we add more criteria we also increase the risk of over-optimizing the selection process.

Third, I agree that the longer the timeframe, the better. Ideally, it should include a period of severe Depression... Practically, we have to work with the data available and this is currently about 4 years, a period when the broader market gained a little less than 50%.

Fourth, having a good understanding of the system's underlying method might be a great selection criterion. The problem is, as a subscriber we can never reliably observe it. While the C2 stats are quite honest, we'll never know for sure about the vendor's underlying method as it depends entirely on what he says instead of on an independent third party's assessment.

Fifth, I also agree that results for future, options, forex, and intraday stock systems might look better or worse than what I showed here for end-of-day stock systems. I'll see if I can replicate the analysis for these other categories. A big problem here is that it is questionable if a subscriber could reproduce the hypothetical trades for some of the scalping system.

Finally, the recent credit crunch has done a lot of damage (not only to C2 systems, but to hedge funds as well). Remember though that the analysis includes many systems that were not affected by the credit crunch at all, e.g. in my first analysis (6 months, split into 2 periods of 3 months), only systems started in 2007 would be affected. But I'll see if I can redo the analysis without including data after May 2007.

One person also mentioned that some systems might have shut down while not closing positions. This could mean that results for the 2nd period look worse (or perhaps better...) than they really are, assuming a subscriber would have closed his positions once the vendor terminated the system. I understand this limitation, but as far as I can see it doesn't apply the majority of the systems in the tables I showed.

As I explained before these results were an important reason for me to suspend trading end-of-day C2 systems. Perhaps I will rerun the analyses a year from now when we'll have longer histories and see if things look more attractive then. To keep myself busy, I started a new C2 system myself: Kauai.

Saturday, November 10, 2007

Some more analysis (3)

We're continuing the previous analysis, but instead of considering 3 and 6 months of history, we're now looking at 9 months:


The first thing we can see is that as the time periods get longer, the Sharpe ratios get smaller. Only one end-of-day stock system was ever launched on C2 with more than 18 months of history, and a Sharpe ratio > 2 for the first 9 months. I won't discuss all the details of the table, as by now I assume readers are familiar with interpreting these results (otherwise: see the previous 2 posts). However, what should be mentioned is the fact that 80% of the top-10 systems for the first 9 months underperformed the S&P 500 during the next 9 months, and in most cases by a substantial amount.

Extending the timeframe further, we get:


Before coming to a conclusion, I'd like to collect some feedback from readers. So what is your interpretation of all this?

Thursday, November 8, 2007

Some more analysis (2)

In my previous post I compared the performance of the highest ranking systems during their first 3 months from inception to their performance during month 4-6. The conclusion of that analysis was that for all but one of the 10 highest ranking systems in the first period, performance during the 2nd period was substantially worse. Still, not taking into account transaction costs and slippage, the average Sharpe ratio of these 10 systems during the second period was slightly better than that of the S&P500 index.

Obviously the choice of 2 periods of 3 months each is arbitrary, and one could argue that 3 months is too short to judge the quality of a system. If that is true, we would expect to see more promising results if we would allow us a longer time period to evaluate a system before subscribing. So, let's look at the performance of 10 end-of-day stock systems with the highest Sharpe ratio's for their first 6 months:


As we can see, "Good NEWS Predictor" is again leading for the first period. However, this time performance during the 2nd period is quite disappointing. "Momentum #3" and "Momentum Breakout" show how bad it can get... We have to be a little cautious though, because I expect that at some point the vendor of Momentum #3 terminated trading the system without closing positions (while the equity curve continuous uncontrolled). In that case subscribers would have halted trading before digesting the full -0.68 Sharpe ratio. Momentum Breakout is quite a tragic case, as subscribers during the 2nd period found there account losing money during a runaway bull market (as indicated by the large negative excess Sharpe ratio).

Also of interest is Trend Plays #1. While it had a very decent Sharpe ratio (and equity curve) for the first period, in fact it underperformed the S&P500 index during that time on a risk-adjusted basis (as indicated by the -0.21 excess Sharpe ratio).

I didn't find these numbers particularly encouraging. Even with half a year of history it is quite a gamble what you'll get as a subscriber during the next 6 months for these systems that all had these attractive equity curves. In a way, it's interesting to look at some current end-of-day systems that will show up in this table half a year from now (i.e. they currently have about half of a year history).

Consider Small Cap Fundamental Value with a Sharpe ratio of 4.3 over 29 weeks:


It would show up right in between Momentun #3 and Good NEWS Predictor. Any guesses about its performance over the next 6 months??? I simply don't know. Perhaps it will do great, perhaps not. So far history suggests it's difficult to judge based on the Sharpe ratio.

Wave Rider (Sharpe ratio 2.2 over 27 weeks) is another system that will be included in the table 6 months from now:


We will continue with longer histories (9 and 12 months) in a few days.

Tuesday, November 6, 2007

Some more analysis

One of the reasons that led to my decision to terminate my portfolio was some analysis I did last week. It was motivated by my experiences in practice: in a few cases I had selected a system with great performance statistics, and it subsequently did quite well in my portfolio; but in other cases the performance was quite disappointing, even though at the time I signed up the system looked great.

So I decided to look at all end-of-day stock systems ever listed on C2 and see how often a "good-looking" system (based on the performance shown on C2) would continue to "look-good" in the future.

I further decided to define "looking-good" as: outperforming the S&P500 index based on the Sharpe ratio. With the underlying idea that I might as well put my money into the SPY (S&P 500 ETF) rather than going through all the trouble of trading if I have no reasonable expectation to get a better Sharpe ratio than the S&P500.

I only included systems with more than 10 trades, and started by taking all systems with a track record of more than half a year. Some of these started way back in 2004, others just 6 months ago; in other words they nicely spread out over time.

Next I downloaded the equity history for each system (using the C2 data api) and calculated the Sharpe ratio for the first 3 months after each system started, and then for months 4-6. What I would hope to see was that systems with a high Sharpe ratio in the first 3 months would also have a high Sharpe ratio in the next 3. Because when that is true, I could pick a system with a high Sharpe ratio as soon as it would have 3 months of track record and expect a nice result for the next 3 months when I would trade it myself!

It turns out, there are 75 end-of-day stock systems with more than 6 months of history. The table below shows the 10 systems with the highest Sharpe ratio for the first 3 months after they were launched:


The table shows that of all end-of-day stock systems ever launched on C2, no one had a Sharpe ratio higher than "Good NEWS Predictor" (4.22) for the first 3 months after inception. Trading it for the next 3 months would turn out to be a good choice, as it got an even higher Sharpe ratio (4.62) for that period. Interestingly, it did actually slightly worse during the first 3 months than the S&P500, as shown in the column Excess Sharpe ratio (i.e. the Sharpe ratio of the system minus the S&P500 Sharpe ratio over the same period). Unfortunately, the other 9 systems were less consistent, as they all did worse in the second period in terms of absolute Sharpe ratio and most did worse as well in terms of excess Sharpe ratio.

In fact--and this is where the trouble starts--half of the systems did worse than the S&P500 in the second period. On average they still outperformed the S&P500 Sharpe ratio by 0.51, but it's a difficult choice between getting the index return for sure, or having a 50/50 chance of out/underperforming the index.

The table also shows that when selecting one of these extremely well-performing systems for the first 3 months, there's a 3/10 chance of ending up with a loss in the next 3 months (negative Sharpe ratio).

As I am planning to show in a subsequent post, the 3 month period is actually a "best-case" scenario: The table looks much worse for many other periods (e.g. 4 months).

Sunday, November 4, 2007

End of the Portfolio

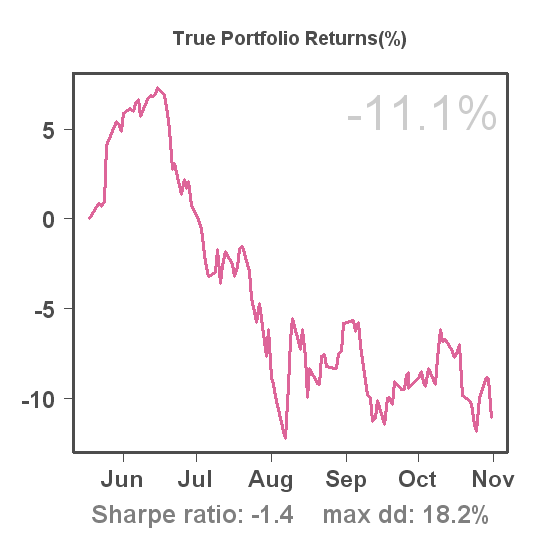
As you've probably noticed, my portfolio has not been doing well for almost the entire past 5 months. Despite all my efforts to analyze systems, I have not been able to pick a profitable set of systems. Whereas the S&P500 is almost exactly back to where it was when I started my portfolio, I am sitting on a loss of 13% (excluding the P/L from my various put options to hedge, the loss would be even larger).

The main problems I have encountered can be summarized as follows:
- Technology issues with auto trading (extreme-os)
- Vendor decided to terminate/change system after major losses (Trend Plays #1, Longstoch-ST)

In addition, I was close to signing up for Positive Forex, which completely collapsed shortly thereafter.

Time to move on!

Tuesday, October 30, 2007

New hedge

The current put options on the Russell 2000 ETF (IWM) will expire in 2 weeks, so it's time to roll them forward. Therefore I sold (closed) the IWM Nov 72 puts today for $0.16 and bought (opened) the IWM Jan 72 puts for $1.26.

Sunday, October 28, 2007

New Portfolio Weights

Starting this Monday, the optimal portfolio weights (for newly initiated positions) will change. Previous optimal weights were:
Weekend Trader: 32%
Trend Plays #1: 53%
ARS: 68%

Starting next week, the new weights will be:
Weekend Trader: 60%
Trend Plays #1: 49%
ARS: 41%

Since the weights sum to 150%, leverage will be about 1.5:1.