Portfolio Performance Statistics
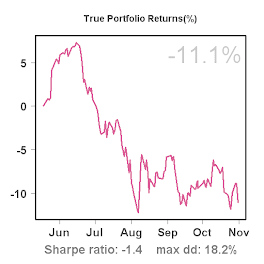
I thought it might be useful to provide a little background on the portfolio performance statistics shown on the right. The P/L curve shows:
(equity[day t] / equity[day 1] - 1) x 100%
in other words, it shows the total percentage gain in equity since I started this blog on 5/21/2007. This is the equity after interest, slippage and commissions and includes the value of the put options I use as a hedge.
Note that my net profits are smaller as my account equity does not include certain costs, such as: C2 system subscription fees, operating costs (e.g. cable internet) and taxes.
The Sharpe ratio is calculated as:
mean(R - Rf) / sd(R) x sqrt(250)
where:
- R is the series of daily returns, calculated as: equity[t] / equity[t-1]
- Rf is a fixed daily risk-free rate: 1.04 ^ (1 / 250)
For simplicity I assume a year has 250 trading days.
The max drawdown is calculated using end-of-day account equity and the number of days shown refers to trading days, not calendar days.


No comments:
Post a Comment