C2 seems to grow fast
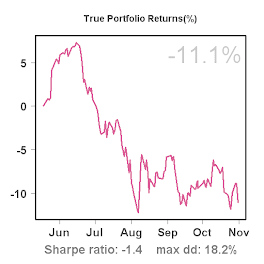
C2 launched a new data api this week and I finally allowed myself some time to play with it. The api makes it possible to download pretty much the entire C2 database of system statistics. The graph below is a first result of hopefully a lot more interesting analysis (if time permits...). At first glance it seems to show a successful stock or perhaps a trading system, but nothing could be further from the truth: The graph shows the number of newly added systems available on C2 during the last 30 days, tracked over time. Thus, during the past 30 days, more than 200 new systems appeared on C2, a record! This is quite a contrast with the number available at the start, almost 4 years ago. As you can see, in the first month only about 20 systems were available. Apparently starting 2005 things really took off, and since then an average of about 100 systems was added each month, with a record for the most recent month. Hopefully many of these new systems will produce some high-sharpe, straight-line equity curves...
(click on picture to enlarge...)


2 comments:
Have you seen the Covestor web site? Something that you might be interested in. It tracks your personal investment progress and shares with others etc. Has some similar themes to C2.
Thanks! I looked at it, but am not sure why successful investors would be willing to share their positions with others in return for knowing the others' positions. It's like playing a game of poker where everyone can see each other's cards. It seems the site is very new, as some functions (earning fees, rankings) are not implemented yet. I'll check it again in a few months and see how it has evolved.
Post a Comment