Please read the disclaimer at the bottom of this page

Tuesday, July 31, 2007

Weekend Trader Rolling Alpha and Beta

This post will be similar to the recent one on Trend Plays #1, but with results shown for Weekend Trader:


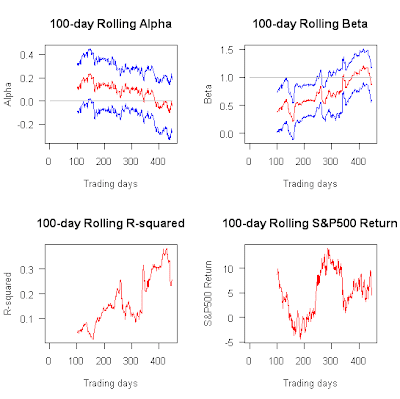
Things don't move in the right direction for Weekend Trader currently, which is unfortunate. Alpha shows a slow but steady decline from 0.12% per day for the first 100 trading days to -0.04% for the most recent 100 trading days. At the same time beta has seen a steady increase from 0.38 to 0.87. Or, in other words, for the last 100 trading days, the system pretty much had the same volatility as the S&P500 with no excess returns. I don't know the reason behind these trends, but I would like to see them reverse (i.e. increasing alpha and decreasing beta). The fact that my portfolio optimizer started to give smaller weight to Weekend Trader in the portfolio is consistent with these results, and when the trend would reverse I'd expect to see the optimal portfolio weight for Weekend Trader go up again.

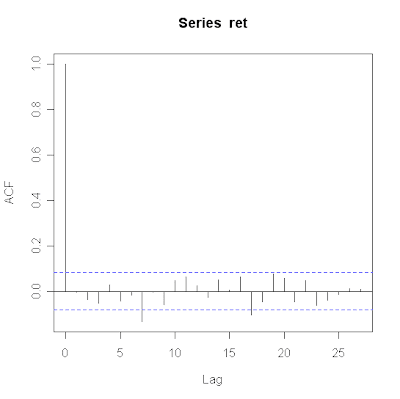
I checked whether the trend was statistically significant (using the same model as discussed for Trend Plays #1), but it wasn't. (tau = -0.00044% per day, with standard error of 0.%, which means it's not statistically different from zero at both the 95% and 90% level).

A possible explanation for the declining alpha could be that as more people started to trade the system over time, the increase in order size started to affect the entries and exits of the system. Therefore, I estimated the rolling alphas and betas again, assuming that all transactions did not take place on Monday at the open (which is the official entry/exit point the vendor uses), but instead on Monday at the close:


As we can see, no clear difference. Hence we can rule out that explanation.

Hedge roll-over

I just rolled-over the SPY put option hedge from the Sep 144 to the Dec 144 contract. The September contracts were purchased for $1.55 on June 1 and sold for $2.80. The Dec 144 contracts were bought for $4.80.

Monday, July 30, 2007

Trend Plays #1 Rolling Alpha and Beta

During the past week I have discussed alpha, beta and R-squared for Longstoch-ST and ARS. These statistics are essential in understanding how much better or worse the system did in comparison to some index (e.g. the S&P 500).

I estimated these statistics for a single point in time, using the entire history of the system available at that (most recent) date. However, it is quite possible that alpha and beta vary over time and that will be the topic of the next few posts.

I calculate rolling alpha's, beta's and R-squared in order to track their change over time. I started with the first 100 trading days and calculated the stats. Then I re-estimated everything using day 2-101, then day 3-102 etc. all the way till the last day of the available history. This is a similar approach to the rolling correlations I estimated a few weeks ago.


The graph in the upper-left corner shows rolling 100-day Alpha's for Trend Plays #1 have varied between 0.05% and 0.35%, i.e. the system outperformed the S&P 500 by at least 0.05% per day on average for any 100-day period since its inception. The statistic is always represented by the red line, the blue lines mark the 95% confidence interval. The graph in the upper-right corner (rolling beta) shows that in the beginning the system was a lot more volatile than the index, probably because it used more than 1x leverage at the time. We can see that since it stuck to 1x leverage more recently, beta has always been smaller than 1 for any 100-day period.

The lower-left corner graph shows that R-squared has been fairly low--it fluctuated between 0.15 and 0.30. Again, a low R-squared is desirable in general, but makes alpha and beta harder to interpret. Finally, I have included the 100-day return for the S&P500 in the bottom-right corner. The reason for this is that we always need to judge alpha and beta in light of the movement of the index. For example, normally we don't like zero alpha, but if a system would only show zero alpha during a strong bull market, combined with a high beta for that period, it simply means the system took advantage of the bull market at the right time. This is what seems to have happened with Trend Plays #1 since day 200: Alpha steadily declined, while S&P500 returns increased--which shouldn't be reason for panic in light of the explanation above.

Obviously an interesting question is whether alpha is declining over time. Looking at the graph it seems to fluctuate, but without a clear trend. We can test this formally by extending the standard regression with a linear time trend, i.e. the model is:

R = alpha + beta * I + tau * days,

where R is the system's daily return, I the S&P500 index daily return and days the number of trading days since the start (this is applied to all the data, not just 100 days). If we estimate the parameters of the model (alpha, beta and tau) through linear regression, it turns out that tau equals -0.0008% and alpha 0.30% per day. With such a decline the model would predict an alpha of zero or lower after day 375 (0.3 / 0.0008), which is less than hundred days from now! Fortunately, the standard error for tau is extremely large (0.001%) relative to tau itself, and hence the effect is far from significant. So, it's not something to be worried about currently, but I will keep a close eye on it in the coming months.

Saturday, July 28, 2007

ARS Alpha and Beta

Alpha and beta for ARS look pretty good:

(S&P 500)


(Best fitting index)


These figures represent alpha and beta for ARS, their 95% confidence intervals, and the fit of the model (R-squared) using daily, weekly and monthly returns. In the uper panel, the S&P500 index is used as a benchmark. In the lower panel I picked the best fitting benchmark (based on R-squared statistic).

We can see that ~30% of the movement of ARS can be explained my the movement of the various indices (an exception is the model for monthly returns where the S&P500 index explains only 21%--here it pays off to pick the S&P100 instead).

The excess returns over the S&P 500 (alpha) are 0.058% per day, 0.30% per week and 1.27% per month, with all betas smaller than 1. Again, as with Longstoch-ST: excess return and lower volatility than the benchmark are good. Note though that the R-squared is higher than with Longstoch-ST, i.e. this system seems to follow the broader market a bit closer.

For those interested, these are the graphs:

Thursday, July 26, 2007

ARS Sharpe Ratio

Last week I discussed the Sharpe ratio of Longstoch-ST, and today I'll follow up with the same analysis for ARS:

Sharpe ratio = 1.49
95% CI [0.18 , 2.68]

To get an idea about these numbers we can compare them to the SPY (S&P 500 ETF), which could have been an alternative option for the same period of 574 trading days:

Sharpe ratio = 0.83
95% CI [-0.46, 2.12]

and we can see that the Sharpe ratio for ARS is almost twice the Sharpe ratio for the SPY (buy & hold).

As before, it is of interest to watch the Sharpe ratio converge as the number of observations gets larger:


The figure shows the value of the Sharpe ratio at each point in time (using the history available at that point), starting when the system is 100 days old (red line). I also shows the confidence interval, which is estimated with the bootstrap method (10,000 replications), using the percentile method (purple) and the preferred BCa (Bias-corrected and accelerated, green).

It seems as if the most recent 200 observations have not changed the estimates of both the Sharpe and its confidence interval much, so the estimate of 1.49 looks pretty stable to me, and not likely to change very sudden.

As before, we can check if any autocorrelation issues exist by plotting some lags:


Contrary to Longstoch-ST, there's actually some autocorrelation present at lag 7 and 17, exceeding the 95% confidence bounds. This is an issue that requires further investigation because autocorrelation can possibly affect both the Sharpe ratio and its confidence interval. I'm curious if the effect will be substantial (I don't think so, but you never know) and I'll come back to this after the weekend.

Wednesday, July 25, 2007

Alpha / Beta Plots

For those who prefer a visual representation of the information in my previous post, have a look at the plots below:


The plot in the upper-right corner shows for each day (dot) the system's return (vertical axis) and the index' return (horizontal axis). The red line is the linear (least squares) regression line, with slope equal to beta and intersection with the horizontal axis equal to alpha.

The plot in the lower-left corner shows the same for weekly returns, and the plot in the lower-right corner shows monthly returns. Finally the plot in the upper left corner shows equity curves and indices using daily data (colors correspond to colors used in daily, weekly and monthly plots, e.g. green = Nasdaq Bank etc.)

Tuesday, July 24, 2007

Longstoch-ST Alpha and Beta

An important question when deciding on including a system is whether it merely tracks an index (possibly leveraged), or whether it is capable of showing good performance irrespective of what the broader market does.

This question can be answered by examining alpha and beta, which are two coefficients obtained after regressing a system's returns on an index' returns. I estimated alpha and beta for Longstoch-ST, their 95% confidence intervals, and the fit of the model (R-squared) using daily, weekly and monthly returns. The index is the S&P500 and results are shown below:


The first thing to notice is that the model fit is extremely poor, as the R-squared is only 0.13 (using daily returns), which means that only 13% of the movement of Longstoch-ST can be explained my the movement of the S&P500. This is good news! The lower the R-squared the better, as I like to deal with vendors capable of picking winning trades without just taking advantage of the index (which, as we all know, did quite well over the last year). The only disadvantage of a low R-squared is that interpreting the alpha and beta coefficients becomes less meaningful.

Still, they look the way we want them to look: positive alpha and beta < 1. Using weekly returns, alpha is 0.59, meaning the system generated an average return of 0.59% per week in excess of any S&P500 return. Ideally, alpha would be statistically different from zero, indicated by a lower bound of the 95% confidence interval greater than zero. We can see that alpha is statistically different from zero for both weekly and monthly returns but not for daily returns. Beta is 0.64 for daily returns, meaning that when the S&P500 index was up (down) 1%, Longstoch-ST was up (down) 0.64% on average. In other words: the system generated returns in excess of the S&P500, with less volatility than this index. That's the best you can get!

Also of interest is the negative sign for monthly betas. It suggests that on a monthly basis the system would be up when the index would be down. However, the number of observations (N) is only 11 and the fit of the model poor, so it doesn't mean anything at this point.

Of course, we don't have to restrict ourselves to the S&P500 index. I repeated the same exercise for 36 other indices (shown at the bottom of this post), and picked the ones with the best fit (highest R-squared):


It apparently pays off to examine other indices as well, because the fit (R-squared) has improved a lot for both weekly and monthly data. Apparently the Nasdaq Bank index is a better matching index than the S&P500 at the weekly level. However, I consider these figures still very low: Out of the 37 indices considered, none was able to explain more than 25% of the variance of the system's returns. With better fitting indices we basically see the same pattern for alpha (positive) and beta (smaller than one). All in all, these statistics played a major role in picking this system and I hope the system will continue to show low R-squared, small beta and (most important) positive alpha.

The indices I included were:

DOW JONES COMPOSITE INDEX
DOW JONES INDUSTRIAL AVERAGE IN
DOW JONES TRANSPORTATION AVERAG
DOW JONES UTILITIES INDEX
NYSE COMPOSITE INDEX
NYSE International 100
NYSE TMT
NYSE US 100
NYSE World Leaders
NASDAQ BANK
NASDAQ BIOTECHNOLOGY (DRM)
NASDAQ COMPOSITE
NASDAQ COMPUTER
NASDAQ FINANCIAL 100
NASDAQ INDUSTRIAL
NASDAQ INSURANCE
NASDAQ NNM COMPOSITE
NASDAQ OTHER FINANCE
NASDAQ TELECOMMUNICATIONS
NASDAQ TRANSPORTATION
NASDAQ-100 (DRM)
S&P 100 INDEX
S&P 400 MIDCAP INDEX
S&P COMPOSITE 1500 INDEX
S&P SMALLCAP 600 INDEX
AMEX COMPOSITE INDEX
AMEX INTERACTIVE WEEK INTERNET
AMEX NETWORKING INDEX
DJ WILSHIRE 5000 TOT
MAJOR MARKET INDEX
NYSE Arca Tech 100 Index
PHLX SEMICONDUCTOR SECTOR INDEX
PHLX THESTREET.COM INTERNET SEC
RUSSELL 1000 INDEX
RUSSELL 2000 INDEX
RUSSELL 3000 INDEX

Monday, July 23, 2007

VGZ (Trend Plays #1) closed for +11.6%

VGZ, a trade from Trend Plays #1, was closed today for a nice 11.6% profit:
entry 6/22/2007 $4.58
exit today $5.11

(click to enlarge)

New Portfolio Weights

As I discussed in other posts this month, I have terminated extreme-os and decided on trading Longstoch-ST instead. Another (4th) system I will include is ARS, which has a history of over 2 years on C2. I will discuss the reasons for including both systems in subsequent posts this week, and for now will stick to the new portfolio weights:

Weekend Trader: 20%
ARS: 65%
Trend Plays #1: 56%
Longstoch-ST: 59%

(note that as before the weights sum up to 200% to reflect 2:1 leverage)

The current weights of Weekend Trader (48%) and Trend Plays #1 (72%) in my account are somewhat different from their new weights. To transition to the new weights, I could sell part of shares for each position. However, these systems hold positions quite long and I may find myself adjusting positions every month, which becomes quite costly in terms of commissions and spreads. Therefore I have decided to change the weights more gradually, i.e. whenever a new trade will be issued for Weekend Trader and Trend Plays #1 this new position will be scaled using the new weight and hence it might take a few weeks/months before the system settles on its new weight (i.e. when all positions have been renewed).

This also means that currently, I can't allocate the full 65% and 59% to ARS and Longstoch-ST (unless I would accept more than 2:1 leverage) and instead will settle for 40% for each. From now on I will post the real weights regularly and monitor how they converge to the target weights.

Sunday, July 22, 2007

Longstoch-ST Max Drawdown per Trade

Yesterday I posted some results on the average return per trade, and in this post I'll look at the average risk (in terms of drawdown) per trade. The figure below shows for each of the Longstoch-ST trades the maximum drawdown of the trade. E.g. if a position was opened for $100, closed for $110, and moved all the way down to a low of $95 in between, the max drawdown of that trade would be 5%.


Looking at the figure, we can see that most trades had a max drawdown between 0 and 6%, while three were a lot larger than the rest (-18%, -13% and -17%). Similar to calculating the expectancy (average return), we can calculate the average max drawdown by taking the average of the length of the bars in the figure, which happens to be -2.73%. We can use the bootstrap to estimate a confidence interval:
95% Percentile [-3.60 , -2.00] ; BCa [-3.79 , -2.10]
99% Percentile [-3.93 , -1.82] ; BCa [-4.21 , -1.94]
(100,000 replications)

These ranges are quite acceptable for me, in particular when taking into account that the drawdown as a percentage of equity is half of these numbers (because the system enters each position with 50% of equity).

The only things that are a little worrying are the few exceptionally large drawdowns. And here we can see the benefits of trading a portfolio of systems! Suppose the weight of this system in my portfolio would be 40%, in that case an 18% per trade drawdown would equal to a 3.6% drawdown on equity (18 x 0.5 x 0.4), which I think is large but still manageable nonetheless.

The vendor actually suggests subscribers to consider a stop-loss between 12 and 25% (the latter being the stop-loss imposed by the vendor), but I'll stick to just following the signals as they are issued by the vendor to match the system's C2 track record as closely as possible.

Saturday, July 21, 2007

Longstoch-ST Per-Trade Statistics

In my previous post on Longstoch-ST I used the daily returns as the unit of observation. In this post I'll switch to the individual trade as the unit of observation. Longstoch-ST has made 70 trades so far, and the graph below shows the percentage P/L (return) per trade (i.e. a position opened for $100, and sold for $110, would show up as 10%). The trades are ordered by the date they were entered. Because the system enters each position with exactly 50% of equity, the account P/L percentage resulting from each trade is half of the P/L per trade.


Two things you'll probably notice immediately is that most of the trades were closed with a profit of 2%, and that there were two trades with large losses (relative to the other trades). Also, more of the recent trades resulted in a loss compared to the older ones.

Despite these losses, the system has a positive expectancy (average return per trade) of 1.17%. I estimated bootstrap confidence intervals at the 95% and 99% level, using both the percentile and BCa method (100,000 replications):

95% Percentile [0.32 , 1.92] ; BCa [0.18 , 1.83]
99% Percentile [0.03 , 2.13] ; BCa [-0.21, 2.00]

Note the large difference between the (simple) Percentile and (advanced) BCa method for the lower bound at the 99% level (0.03 vs -0.21, positive vs negative expectancy).

To get an idea how this first outlier return (-16.9%) affects these results, let's repeat without this trade included:

mean return = 1.44%
95% Percentile [0.80 , 2.05] ; BCa [0.77 , 2.02]
99% Percentile [0.59 , 2.24] ; BCa [0.55 , 2.20]

I think the results including the first trade were pretty good, but this looks even better. The question is: What was going on with this first trade, how likely is it that we'll see this happening in the future, and with what frequency?

It turns out this particular trade was NTAP, entered 7/11/2006 31.41, closed 7/17/2006 26.11. From the chart (below) we can see that the trade was not the result from a sudden overnight gap due to some unexpected earnings news etc. It was bought in a short-term downtrend, which unfortunately did not reverse. As such I put more value on the first set of estimates (including the trade). Because it happened only once so far, there's very little we can say about how often it is expected to occur again.


Tomorrow I'll post some results on drawdowns per trade and discuss how a stop-loss (as the vendor suggests to his subscribers) would have worked out.

Thursday, July 19, 2007

Nice Profit on Trend Plays #1 Trade

It has been a while ago since the last trade closed for Trend Plays #1 in Mid-June. This morning a limit was hit on CACS, however, and it was closed for a very nice (+29%) profit.

Wednesday, July 18, 2007

Thank you!

I started this blog exactly two months ago, and since then there have been 1,400 unique visitors and over 3,200 page views. I'm very motivated to continue this effort and hope it will benefit many. Feel free to post any suggestions how to further improve this blog, as I'm always open to change.

First Positive Forex Auto Trade Demo Results

Two weeks ago, I started trading Positive Forex in a BulldogFX demo account, using C2's "2nd generation autotrading".

The first couple of trades were closed yesterday, and the fills match the C2 hypothetical fills very well.

These are the trades shown by C2:


And this is what I got in my demo account:


Obviously the entry fills do not match, because these trades were already open before I started the demo. For the EUR/AUD position the exit fill in my demo account was 3 pips better than the hypothetical C2 fill. For the other two positions, AUD/USD and USD/CAD the fills were identical. Also note that the scaling worked nicely: the 70 minilots for EUR/AUD and USD/CAD appeared in my demo account as 1 minilot, while the 140 minilot AUD/USD appeared as 2 minilots.

Tuesday, July 17, 2007

another extreme-os missed signal

I just missed another (exit) signal for extreme-os (SYNL). This turned what is shown by C2 as a winning trade into a losing trade in my account. I have decided to terminate autotrading immediately to protect my trading capital.

extreme-os missed trade

Yesterday I missed an extreme-os trade, GDP, that closed today for a substantial profit. It was missed due a technical problem, and we're still figuring out what the cause of the problem was. It seems my decision to terminate auto trading on my PC was right. The extreme-os subscription ends at the end of this week, and I will announce the new portfolio weights (including Longstoch-ST) very soon.

Monday, July 16, 2007

Longstoch-ST Sharpe ratio

The first thing I usually look for in a system is a high Sharpe ratio. It is reported, together with its confidence interval by C2:

Sharpe ratio = 2.2
95% CI [0.14 , 4.2]

To get an idea about these numbers we can compare them to the SPY (S&P 500 ETF), which could have been an alternative option for the same period:

Sharpe ratio = 1.5
95% CI [-0.6, 3.6]

The system does quite a bit better, I'd say!

Now, these are all estimates for a single point in time (today). Last month's estimate was likely different, and so will next month's estimate be. But as more observations (days) become available, we might expect these ratios to converge and the confidence interval to narrow. I like to watch this convergence over time, and hence I plot the value of the Sharpe ratio at each point in time, starting when the system is 100 days old (red line). I also plot the confidence interval, which I estimate with the bootstrap method (10,000 replications), using the percentile method (purple) and BCa (Bias-corrected and accelerated, green). I won't go into detail about the difference between the green and purple line, except for noting that the BCa (green) method is usually considered a superior estimate.


What we can see from the graph is that the Sharpe ratio was declining steadily from about 3 around day 100 to about 2 around day 200, and seems to have settled around 2 between days 200 and 250. Meanwhile the lower bound of the 95% confidence interval has been fluctuating between -0.5 and +0.5 with no clear trend.

All in all, I don't see any alarming patterns, and in an ideal scenario the Sharpe ratio would converge around 2 over time with the confidence interval narrowing further. This would also be close to the 5-year backtested results (2.14 Sharpe ratio) posted by the vendor on C2. I would consider a Sharpe ratio of 2 as quite good, and few end-of-day systems available on C2 show considerably higher Sharpe ratio over a similar or longer period.

One concern about using these bootstrap methods for confidence intervals is that they may be unreliable in case returns are autocorrelated. So to be sure, we check for autocorrelation, by plotting the correlation of the return at day t with the return at day (t-1), (t-2), ..., (t-12) and see if any of these lags are correlated. Results are shown below, and suggest that none of these correlations are significant (i.e. the bars stay within the horizontal bounds), which means that we can safely use these bootstrap methods for the Sharpe ratio confidence intervals.

How long until you're a millionaire?

The vendor of Trend Plays #1 brought to my attention the existence of a handy free calculator to calculate the final equity with compounded returns:

calculator

I like these tools a lot, as they nicely demonstrate the incredible power of compounding. For example, an annual return as low (or high, whatever you prefer to call it) as 30% will turn $100K into $10MM within just 16 years.

If you want to get rich and have time, all you need is a steady annual return around 20-40%.

Saturday, July 14, 2007

Longstoch-ST

The coming week I'm planning to terminate trading of extreme-os, and add a new system to the portfolio, called Longstoch-ST. Like the other systems currently in the portfolio, the vendor of Longstoch-ST has chosen Collective2 to track performance:


I have done quite a bit of analysis on the system and will post some of the results over the next few days.

Thursday, July 12, 2007

ANF

I think it's interesting to share every now and then a trade that played out well. This morning there was a large profit on an extreme-os trade, which was entered two days ago (69.68) and closed this morning (74.10) for a 6.3% profit:


Extreme-os is supposedly based on a mean-reversion strategy and usually holds stocks for 1-2 days. It has happened quite often that they gap up the next day and the system locks in a very decent profit. But when it doesn't recover the losses can be substantial as these stocks are often in a downward trend at the time they were picked.

drawdown

The portfolio is experiencing some drawdown lately, which is partly caused by extreme-os. Drawdowns for this system, when exceeding 3-4%, are typically quite short, as shown by the graph, and recovery (from the -8% to the -3% level) previously was always only a matter of days.


Note that this graph does not include the most recent drawdown, which shows up as about 8% on C2 and is the largest drawdown on the hypothetical equity curve.

It will be interesting to see if the recovery is as quick as before. My subscription to the system ends at the end of next week, and it is quite possible that this will coincide with the bottom of the drawdown. Of course that wouldn't be the preferred scenario, but on the other hand the decision to terminate the system was already made a few weeks ago and the current drawdown did not play a role in that decision.

Sunday, July 8, 2007

Positive forex analysis

What keeps me busy at this moment is researching Positive Forex...


I am considering to include it in my portfolio some time and to determine the appropriate weighting relative to the other systems, I need to reconstruct the daily returns series from the trades posted on C2. Although C2 has made it possible recently to download the returns series, I want to be able to generate my own (based on the trade entries and exits) for the following reasons:
- Positive forex seems to adhere to a constant position size, while I want to increase the position size as my account grows and decrease the position size when my account equity decreases. So I need to backtest the system where the position is a constant % of available equity.
- C2 supposedly does not take into account interest (swap) for forex positions, which I think is not very realistic as almost any forex account charges and pays interest.

So, these are the steps I need to take to accomplish this goal:
1. Download the free Gain forex quote data, inspect/clean it and transfer the tick data into daily data.
2. Download the trades from C2.
3. Construct an equity curve (daily returns) for the system using the data from step 1 and 2.
4. Modify the equity curve such that interest is included.

I'm now working on step 1. I downloaded the Gain data (1 Gig, 1,945 files zipped) with a script I wrote in VBA. I then wrote some R code that processes these files and turns them into .csv files with daily closing (bid-ask) prices (recorded at 4 pm EST, i.e. as close as possible to the time stock market closing prices are recorded). Next thing is to do some checks on the data, look for gaps, unusual spreads etc.
Step 2 is easy (as I am already used to download data from C2 for other systems) and for step 3 I can use most of the code I wrote earlier for stock systems.

I'll keep you updated...

Wednesday, July 4, 2007

Evaluating June

June was the first full calendar month that the portfolio was live. Let's see how the real-life results compare to the backtested results. The figure below shows the backtested results, using the portfolio weights I chose at the end of May. The blue part of the curve shows what was known on May 31st, the red part shows the "walk-forward" results for June. Remember, these curves assume daily rebalancing (not very realistic), no transaction costs, but they do take into account slippage for extreme-os. We can see that the red part (walk-forward) is not really different from the earlier backtested results, which is good. Obviously it was a losing month, with some drawdown, but these have occurred previously in the blue part of the curve as well.


The next question is: How did our real-life results compare to the June walk-forward test results (red part of the curve)? That is shown in the figure below. Due to the hedge (which is neither included in the backtest nor the walk-forward test), we can see that volatility is lower in the real life results. At the end of the month the curves nicely come together, but we have to remember that without the hedge real-life returns would have been worse (as expected) than the walk-forward returns. This is, again, because the latter do not take into account transaction cost and assume daily rebalancing.

Monday, July 2, 2007

Live!

Just a few minutes ago, my "generation 2" auto trading account went live...


Currently 4 positions are open on a $5,000 demo account. Even though Positive Forex has not issued new signals yet, the demo account is sync'ed automatically with the current positions held by the system. I.e., we jump right in on the current state of the system equity curve. Of course, this means that the per-trade profits of these open trades will be different from what is shown by C2. Looking forward to see the first execution of a real signal...

Sunday, July 1, 2007

"Generation 2" autotrading demo

A few days ago I decided to terminate auto trading using TradeBullet on my PC at home. Supposedly the technical problems I encountered are addressed in what C2 calls "generation 2" auto trading. This (relatively) new form of auto trading means that the signals go directly from C2 to the broker, bypassing the PC at home (the latter being not necessary anymore). Unfortunately this setup does not work with my broker, Interactive Brokers, and the only alternative for stocks is Optionsxpress, which charges commissions starting at $9.95/trade. Given the size of my equity, these commissions are not attractive when trading extreme-os (with dozens of trades per month).

However, "generation 2" auto trading is also available for forex, in which case C2 sends the signals directly to BulldogFX, an introducing broker for FXCM. I'm going to give this a try on a free demo account and see how well the signals execute. Positive forex is a C2 system already on my watchlist for a few months, so I just subscribed and set up auto trading such that the signals will be executed in my BulldogFX/FXCM demo account. Of course this does not involve real money and therefore the profits/losses in the demo account won't affect the "Real life" equity curve, shown on the right.