ARS Alpha and Beta
Alpha and beta for ARS look pretty good:
(S&P 500)
(Best fitting index)
These figures represent alpha and beta for ARS, their 95% confidence intervals, and the fit of the model (R-squared) using daily, weekly and monthly returns. In the uper panel, the S&P500 index is used as a benchmark. In the lower panel I picked the best fitting benchmark (based on R-squared statistic).
We can see that ~30% of the movement of ARS can be explained my the movement of the various indices (an exception is the model for monthly returns where the S&P500 index explains only 21%--here it pays off to pick the S&P100 instead).
The excess returns over the S&P 500 (alpha) are 0.058% per day, 0.30% per week and 1.27% per month, with all betas smaller than 1. Again, as with Longstoch-ST: excess return and lower volatility than the benchmark are good. Note though that the R-squared is higher than with Longstoch-ST, i.e. this system seems to follow the broader market a bit closer.
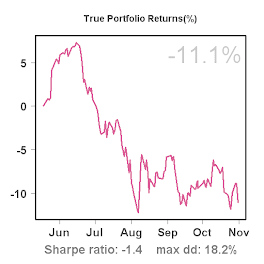
For those interested, these are the graphs:


1 comment:
Hi ScienceTrader,
I have some concerns against using "alpha" as a quality measure.
First, as long as the returns of S&P average to zero alpha is exactly the average return of the trading system. If S&P is in a rally, alpha (the intercept of the regression line through a "wild" point cloud) becomes dependent on beta, which may be "anything" if correlation is low (which is preferable).
I'd suggest to measure the rolling "advantage" of a system versus S&P by comparing the rolling average returns.
But even then:
The "ideal" trading system has a equity curve like a straight line: constant slope, low "noise" (aka stddev). If the S&P has a steep rally for some weeks, it makes the trading system look bad in these times, which is true for a naive trader only.
r-squared is something different and I agree that its preferable to have a low r-squared (and probably a negative beta, which is a noisy measurement anyway)
Post a Comment