ARS Excess Sharpe Ratio
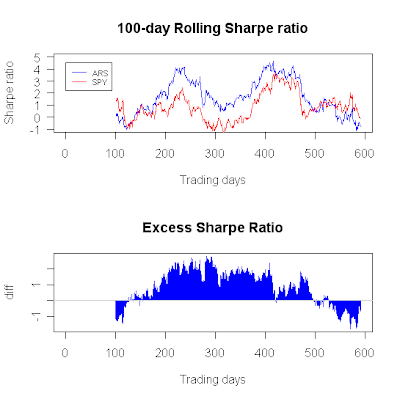
Please find below the 100-day excess Sharpe ratio for ARS. See here for an explanation of the excess Sharpe ratio.
(click to enlarge...)
As the figure shows, ARS outperformed the SPY on a risk-adjusted basis for most of the 100-day rolling windows, although recently it substantially underperformed. Testing for difference between the Sharpe ratio of ARS and the Sharpe ratio of the SPY over the entire history (590 trading days), we find that it's not statistically different from zero, as the 95% confidence interval is [-0.58, 1.81].


No comments:
Post a Comment