ARS Sharpe Ratio
Last week I discussed the Sharpe ratio of Longstoch-ST, and today I'll follow up with the same analysis for ARS:
Sharpe ratio = 1.49
95% CI [0.18 , 2.68]
To get an idea about these numbers we can compare them to the SPY (S&P 500 ETF), which could have been an alternative option for the same period of 574 trading days:
Sharpe ratio = 0.83
95% CI [-0.46, 2.12]
and we can see that the Sharpe ratio for ARS is almost twice the Sharpe ratio for the SPY (buy & hold).
As before, it is of interest to watch the Sharpe ratio converge as the number of observations gets larger:
The figure shows the value of the Sharpe ratio at each point in time (using the history available at that point), starting when the system is 100 days old (red line). I also shows the confidence interval, which is estimated with the bootstrap method (10,000 replications), using the percentile method (purple) and the preferred BCa (Bias-corrected and accelerated, green).
It seems as if the most recent 200 observations have not changed the estimates of both the Sharpe and its confidence interval much, so the estimate of 1.49 looks pretty stable to me, and not likely to change very sudden.
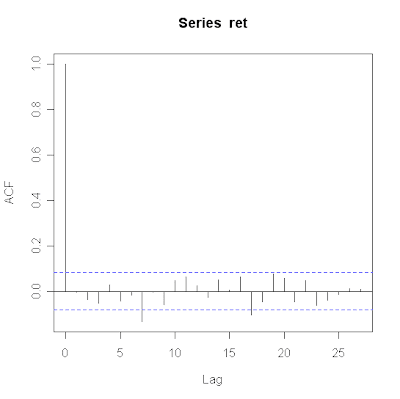
As before, we can check if any autocorrelation issues exist by plotting some lags:
Contrary to Longstoch-ST, there's actually some autocorrelation present at lag 7 and 17, exceeding the 95% confidence bounds. This is an issue that requires further investigation because autocorrelation can possibly affect both the Sharpe ratio and its confidence interval. I'm curious if the effect will be substantial (I don't think so, but you never know) and I'll come back to this after the weekend.


3 comments:
I really appreciate your post and it was superb .Thanks for sharing.
Regards:
http://www.liveforexcalls.com
Trading is very difficult, you should consider following a good forex signals service with live statements published http://www.robotforexsignals.com
Great post, I'm following your tips.
http://ProductosLimpiezaHoreca.es
Post a Comment