What does a high Sharpe ratio say?
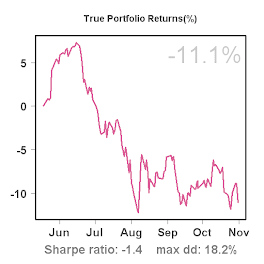
The Sharpe ratio is often used as a measure of reward/risk and might be interesting as a criterion to select a system on C2. However, does past performance on the Sharpe ratio predict future performance? I'm not ready yet to show a rigorous analysis, but some preliminary findings might be interesting.
What I did a few weeks ago was to select all stock systems with at least a 1-year history (on C2). I then selected only those with a Sharpe ratio of at least 2 in the first year (250 trading days) since they appeared on C2. Finally, I calculated the Sharpe ratio over the period after the first year (not taking into account slippage and transaction cost). The underlying idea is: Suppose we would pick systems with Sharpe ratios > 2 and at least a 1 year history, how would they do afterwards.
The results are very interesting. I found 6 systems trading stocks with Sharpe ratio's >2 in their first year:
Mutual Fund Trader 2.25
extreme-os 4.53
vicinoo! trading - Daytrading 2.74
Tango 3.64
MBN-1 2.03
Weekend Trader 2.28
These are the Sharpe ratios I calculated for the period after the first year (note the length of this period is different per system, with the shortest being 89 trading days for MBN-1 and the longest being 399 days for Mutual Fund Trader):
Mutual Fund Trader 1.09
extreme-os 3.87
vicinoo! trading - Daytrading 2.48
Tango 2.03
MBN-1 -0.18
Weekend Trader 1.19
Interestingly, all Sharpe ratios in the second period are lower than in the first, but still very acceptable, except for one system: MBN-1. The ranking of systems is almost the same in both periods (except for Tango).
This seems to suggest that the Sharpe ratio has been quite informative for stock systems till so far. Of course, this is no guarantee that it will stay this informative in the future.


No comments:
Post a Comment